An influence diagram is a simple visual representation of a decision problem. It provides an intuitive way to identify and display the essential elements, including decisions, uncertainties, and objectives, and how they influence each other.
To avoid one big and complicated influence diagram, we divide
it into three parts: Firm Demand (FD), Average Firm Demand (AFD), and Normalized
Market Share (NSOM).
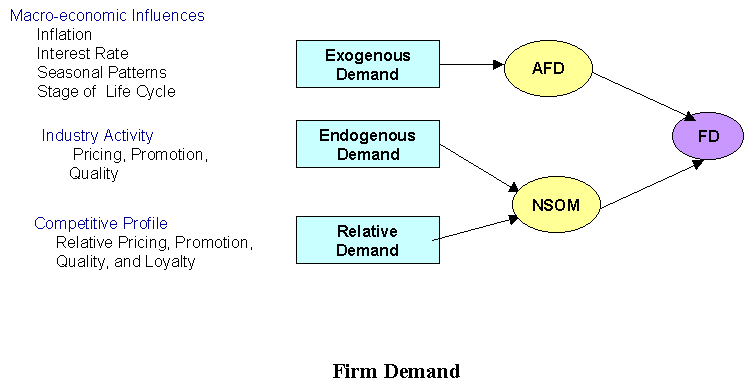
1) Firm Demand
This diagram shows how macro-economic factors, industry behaviors, and the firm competitive profile influence the average firm demand and normalized firm market share. These, in turn, influence the demand for the firm's products. Macro-economic factors include variables like inflation, interest rate, seasonal patterns, etc. Industry behavior refers to the activities within the industry as a whole, including average price, promotion, quality, etc. Competitive profile depicts the firm's specific activities relative to the industry.
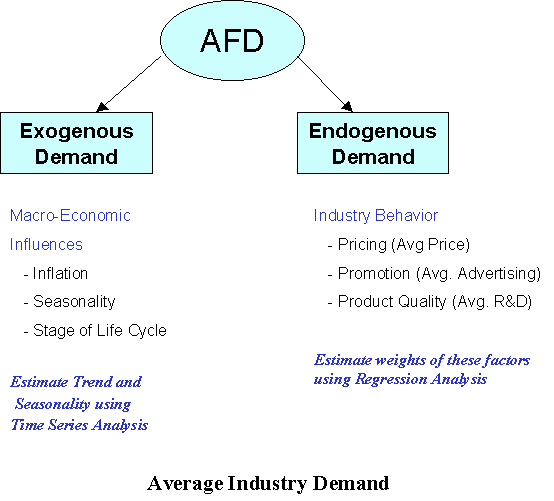
2) Average Firm Demand
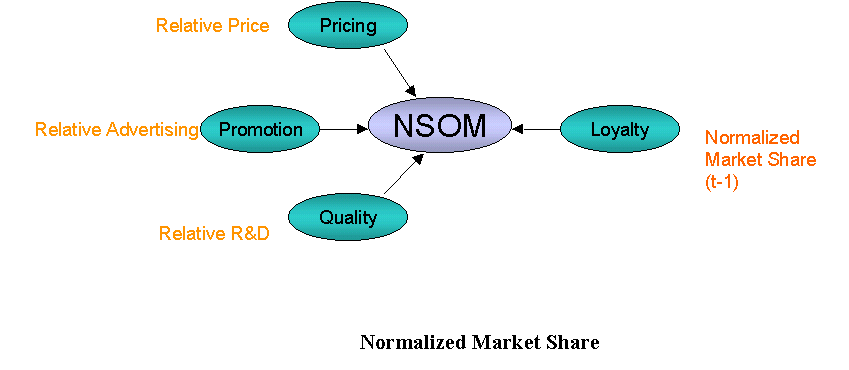
3) Normalized Market Share